
By Otto Spijkers
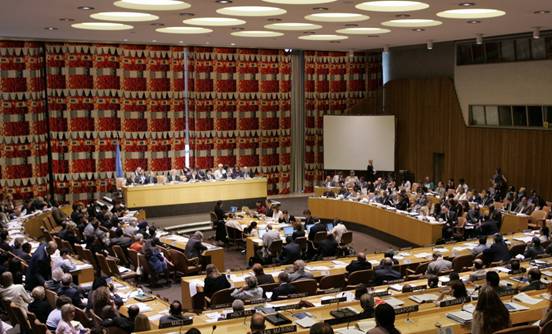 The issue of equitable geographic representation at the various organs and bodies of the United Nations is always topical, so I guess it deserves a blog post even though I have no recent development relating to this issue to address specifically. It is an interesting topic, both for politicians and for those who like to work with statistics and calculators. The end-result of any application of the principle of equitable geographic representation, I guess, is always based on both cold calculation and hot politics. For a UN report on the issue, see here. So let’s look at some examples where we can apply the principle… Membership of ECOSOC (see picture above) is based on equitable geographic representation. This has led to the following composition:
Of 54 seats, 14 are allocated to African States, 11 to Asian States, 6 to Eastern European States, 10 to Latin American and Caribbean States, and 13 to Western European and other States.
Membership of the former Commission on Human Rights was also based on equitable geographic representation. The result is as follows:
Of 53 seats, 15 are allocated to African States, 12 to Asian States, 5 to Eastern European States, 11 to Latin American and Caribbean States, and 10 to Western European and other States.
It is interesting to note that the application of the same principle to a body of 54 and 53 leads to 13 and 10 seats for Western Europe and Other States, respectively. Anyways, this Human Rights Commission was recently replaced by the Human Rights Council. Membership of that body is also based on the same principle, and this has led to the following composition:
Of 47 seats, 13 are allocated to African States, 13 to Asian States, 6 to Eastern European States, 8 to Latin American and Caribbean States, and 7 to Western European and other States.
And when we look at the internship community of Spring 2008 (I have no idea whether this is representative of the intern community in general), we see the following:
Of 157 interns in the UN Intern Yearbook of Spring 2008, 13 are from Africa, 38 from Asia, 3 from Eastern Europe, 17 from Latin American and Caribbean States, and 86 from Western European and other States.
There is a lot to say about these figures. First, I guess – but I am not sure! – that the interns are selected based on the same criteria as the staff members, i.e. ‘the paramount consideration […] shall be the necessity of securing the highest standards of efficiency, competence, and integrity [and] due regard shall be paid to the importance of recruiting the staff on as wide a geographical basis as possible’ (article 101 UN Charter, which does not seem applicable to interns because they are not staff members). Second, the number 157 I find somewhat surprising, because I know there were around 220 interns. I guess some of those did not want to appear in the Yearbook. And third, none of the interns are paid by the Organization (on this issue, see my previous post). According to Wikipedia (and who would doubt that wonderful source of information?) the five groups referred to above have the following membership at the General Assembly, whose membership, as we all know, is universal and thus need not be based on the same principle of equitable geographic representation referred to above:
Of 192 members, 53 are African States, 53 Asian States, 23 Eastern European States, 33 Latin American and Caribbean States, and 27 Western European and other States.
That makes 189, which means there are 3 missing. That’s the United States of America, Israel and Kiribati. I think one could easily include the first two in the Western European and Others Group, because they generally vote and run for elections as part of that group. I don’t know much about Kiribati. If you look at the world population, what would be the proportion? It would be somewhat like this, again the source is Wikipedia:
Of the world population, 24% live in Africa, 57% in Asia, 9 % in Latin American and Caribbean States, and 10% in Eastern Europe, Western European and other States.
Here you see a map where each country’s size is based on population:  Of course, this is just one way of dividing the world. One could also look at financial contributions to the United Nations budget, or power, or wealth, or what you have. Here you see a map where each country’s size is based on Gross Domestic Product (GDP) per person:
 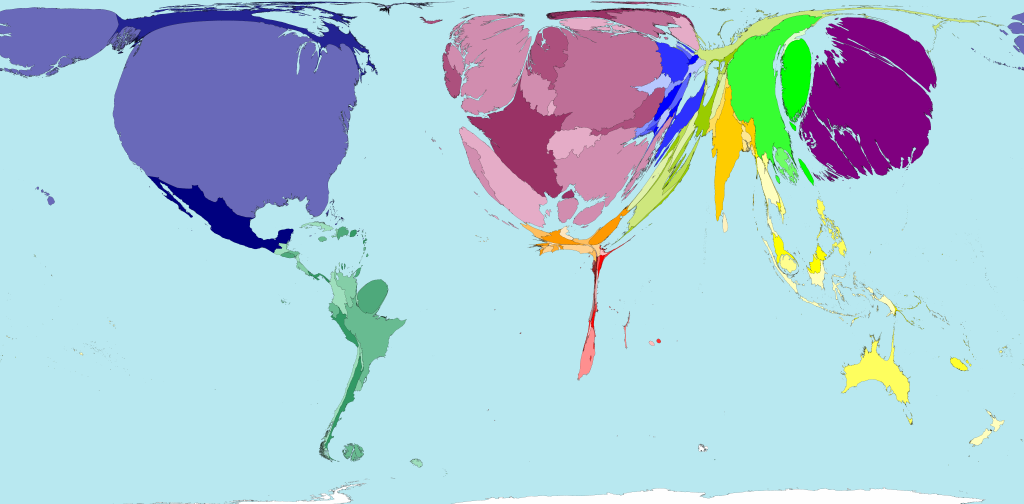 Both maps come from a wonderful website called Worldmapper. I am not very good with numbers, but I think that if you look at the percentage of seats/population of Europe and Other States in all these lists, it is: 35% (ECOSOC), 28% (Commission), 28% (Council), 57% (interns of Spring 2008), 26% (General Assembly; 27% if you include the USA and Israel), and 10% (World Population). I am not trying to make a political point here, so I do not want to draw any conclusions from all these numbers. I just find it interesting to think about them.